Back to Portfolio Engagement Case Study

Overtime down 22% in one quarter.

The client: an $18M contract fulfillment operation. 70 employees, two shifts, ship SLAs to protect, and a schedule built Sunday night on last year's gut feel. Every Friday was a surprise.

The Friday scramble, on repeat

  1. Sunday night. Next week's schedule built from last year plus instinct.
  2. Wednesday. A client promo lands. Nobody converted it into labor hours, because nobody knew.
  3. Thursday. The pick lines fall behind. Supervisors start doing math on whiteboards.
  4. Friday, 6:00am. The backlog is visible. The floor walk begins: who can stay tonight?
  5. Friday, 4:00pm. Premium hours bought at 1.5x to protect ship SLAs. The same 15 people carry it.
  6. Next Sunday night. Same schedule method. Two people quit last year citing exactly this.

WHAT THAT COSTS, MEASURED

~320overtime hours a week, quarter average
~15%of that overtime was planned. The rest was Friday
~27%forecast error, when a forecast existed at all
$137Kovertime spend in the prior quarter

EXHIBIT 01 · ONE WEEK OF REACTIVE OVERTIME
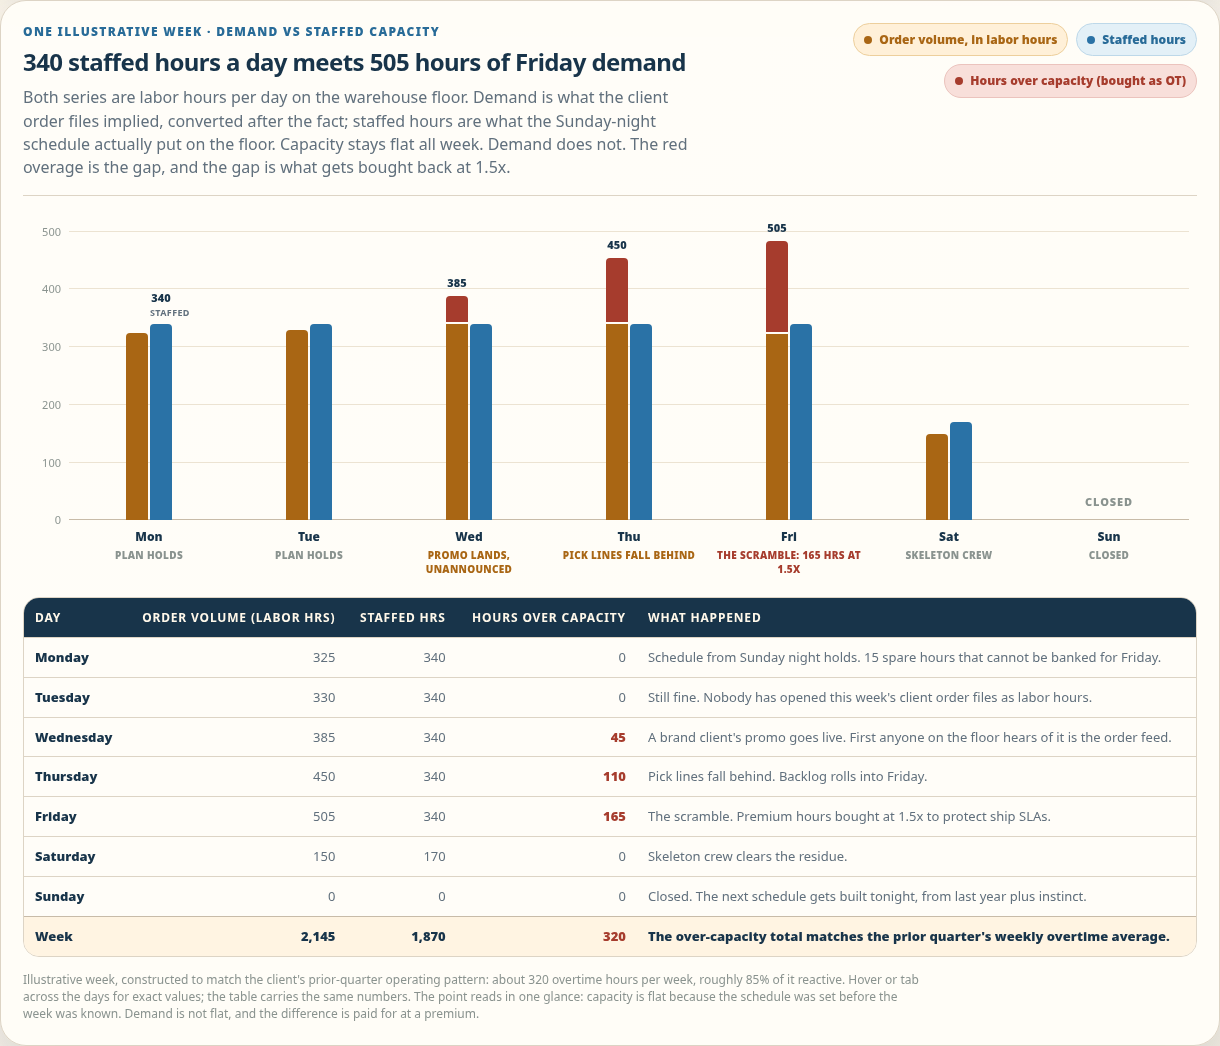
Grouped bars: daily demand in labor hours versus flat staffed capacity; Wednesday promo pushes Thursday and Friday far over capacity FROM THE ENGAGEMENT EXHIBITOpen full exhibit →

Capacity flat, demand spiking, and the gap bought back at 1.5x every Friday. The full document adds the scramble timeline and the quiet costs.

A forecasting problem wearing a scheduling costume

The volumes were knowable. Client order files arrived weekly; promos had calendars; seasonality repeated. Nobody converted any of it into labor hours, so overtime absorbed the difference between guess and reality.

The fix was not banning overtime. It was deciding it on Monday instead of begging for it on Friday.

And deliberately: no workforce-management platform, no black-box forecast. A model the GM can read, in a workbook, refreshed by one small script. Nothing else was stable enough to deserve automation yet.

A model the GM can read, and two short meetings

PART 01 · THE READABLE FORECAST

Full model →

Trailing baseline, seasonality, and one political rule

An 8-week trailing baseline by client and activity, seasonality factors, and the promo-intake rule: clients declare peaks two weeks out, enforced by leadership from week one. The forecast is statistical and explainable. The GM can defend every number in it.

PART 02 · MEASURED STANDARDS AND THE WEEKLY PLAN

Full model →

Forecast units in, staffing decisions out

Labor standards measured on the floor for two weeks across the six core activities. Then one table each Monday: forecast units, required hours by activity and shift, scheduled hours, gap, and the chosen action: planned overtime at chosen crews, a shift swap, or a temp request. Schedules publish five days ahead.

Mon30-minute planning: plan published, schedules out 5 days
Fri20-minute review: forecast vs actual, standards drift, next week's risks
6activities with measured standards: pick, pack, kit, receive, returns, ship
1workbook plus one refresh script. No platform. On purpose

What was deliberately not built: workforce-management software, machine-learning forecasts, automated scheduling. Each has a written trigger for later. None earned its place yet.

PART 03 · THE QUARTER

Full results →

Thirteen weeks, and one planned peak

−22%overtime spend vs the prior quarter
3,245overtime hours vs 4,160 the quarter before
~$30Ksaved in the quarter, at the illustrative loaded rate
~70%of remaining overtime was planned, up from ~15%

Week 13 is the lesson: a client holiday promo, declared two weeks out, staffed with overtime chosen on Monday at crews who volunteered in advance. Overtime did not disappear. It became a decision. See the 13-week trend →

One quarter apart

MetricBeforeAfter
Overtime spend~$137K per quarter~$107K: down 22%
Planned share of overtime~15%~70%
Forecast error~27%~11% by quarter end
Schedule visibilityDay before, sometimes same day5 days ahead, every week
Friday scramblesWeeklyTwo in thirteen weeks, both caught by Wednesday
Ship SLAsProtected by heroicsHeld every week, by plan

What does your Friday cost?

Builds like this follow a diagnostic. Send 3 to 5 recent examples where the week surprised you and overtime paid for it, and I'll tell you whether the audit is the right fit. dan@diazovate.com

Book the Audit Starts at $2,500, scoped on the intro call.